
Finance
Three years in… $$$
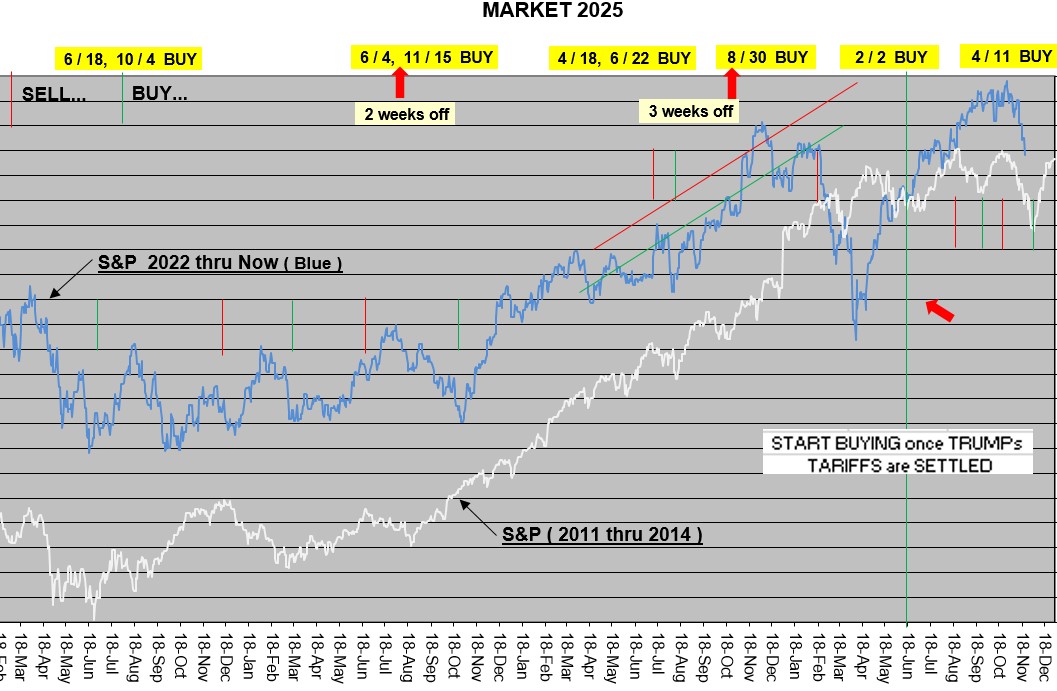
Following 2011 thru 2014 Market S&P results (based on amount of liquidity added to the Market in 2009 & now 2020…
The chart above shows the S&P & its current performance over 3 years… (updated 21 NOV 2025 )
NOTE: MARKET was sideways in 2014, so patience is important ( buy low — sell high )
STOCKS (bought this year)
_ _ _ _ _ PRICE _ _ DIVENDENDS
FEB ( 2026 )
WEN ._ _ $7.15 ._ _. 7.2%
FLO ._ ._. $9.80 ._ _ 9.2%
PZZA ._ _ $30.35 ._. 5.9%
DPZ ._ ._. $380 ._ _. 1.8%
CRM ._ _. $184 ._ _. 0.8%
MSFT _ _ $395 ._ _. 0.8%
PANW _ _ $346
CRWD _ _ $370
NOW ._ _. $100
NOV
WEN _ _. $8.00 ._ _. 6.4%
DOW _ _ $21.50 ._ _ 6.3%
MTDR ._. $40.00 _ _ 3.8%
COP ._ _. $87.00 _ _ 3.6%
CBRL _ _ $27.00 _ _ 3.3%
JD ._ _ _. $28
MAY
HPQ ._ _ $23.00 _ ._ 5.1%
AAP ._ _. $31.50 _ .._ 2.1%
PLUG _ _ $0.715
GOOGL _ $148.00 __ 0.5%
APRIL
VALE _ _ $8.22 __ _ 11.0%
BIDU _ _ $74.00 _ _ 10.1%
BLMN . _ $6.55 __ ._ 7.9%
PFE __ _ $22.00 _ ._ 7.3%
F .___ _. $8.60 __ _ 5.8%
BBY ._ _. $56.00 _ .._ 5.7%
TGT ._ _. $88.00 _ ._ 4.8%
PZZA _ _ $31.00 _ .._ 4.1%
SWKS _ . $49.00 _ .._ 4.1%
MCHP _ . $35.00 _ ._ 3.1%
INTC _ _ $18.00 _ .._ 2.6%
DELL _ _ $73.00 _ .._ 1.9%
FCX ._ _. $30.00 _ .._ 1.6%
TSM ._ _ $135.00 _ ._ 1.5%
AMAT _ . $122.00 _ ._ 1.2%
CX .__ _ $5.07 __ __ 1.2%
LRCX ._ . $65.00 _ .._ 1.1%
AMD _ _ $78 _/_ NOW _ _ $730
GOOGL _ $141 _/. MU _ _ $63.80
BABA _ _ $100 _/ NVDA _ . $102
PANW _ . $154 _/. SHOP _ _ $70
AMZN _ . $164 _/. SMCI _ _. $28
WMT .. _ $80 _/_ MSFT _ . $353
SLV _ _ . $27.11 _/ CRWV _ .. $38
AVGO _ . $143.20 / NET _ _. $100
CRWD _ _ $310
RISK FREE
SGOV __ $100.xx _ _ 4.2% _ _ _ ( 0-3 mo. Treasury Bond )
NAILED THE LOWS… Ten month in… (2024)
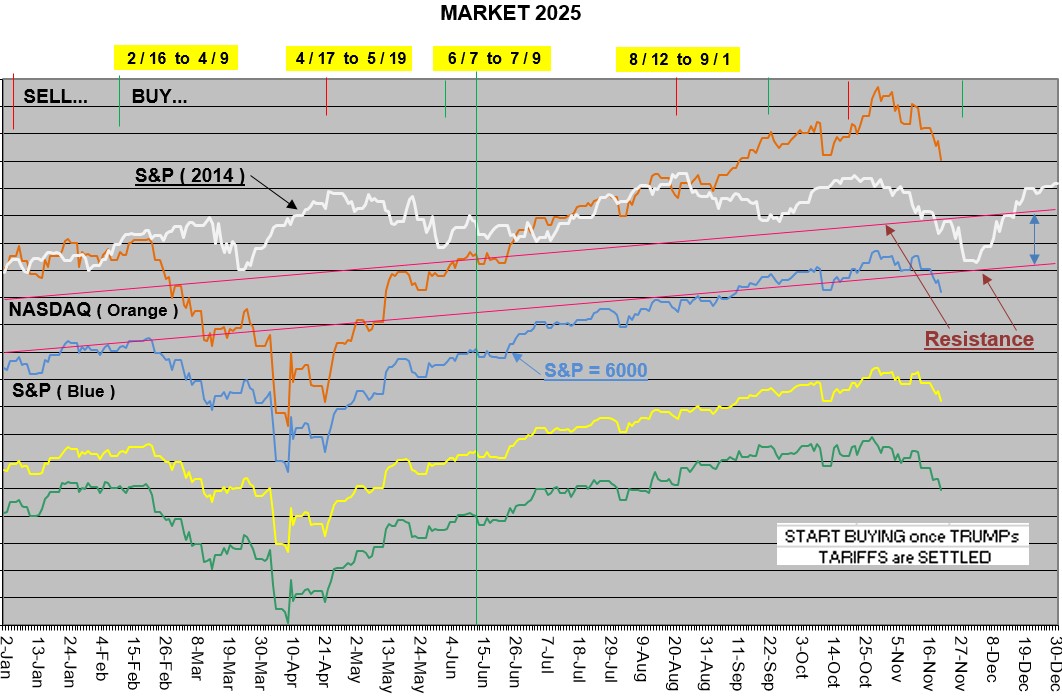
Following 2013 Market S&P results (based on amount of liquidity added to the Market in 2009 & now 2020…
The chart above shows the S&P & its current performance this year… (updated 21 NOV 2025 )
NOTE: a shift was built in, which helped nailed the August dip. BUT 4th quarter dip has been occurring 8 weeks later than displayed (refer to 2011 & 2012 charts).
NAILED THE LOWS… One month lag on the HIGHs
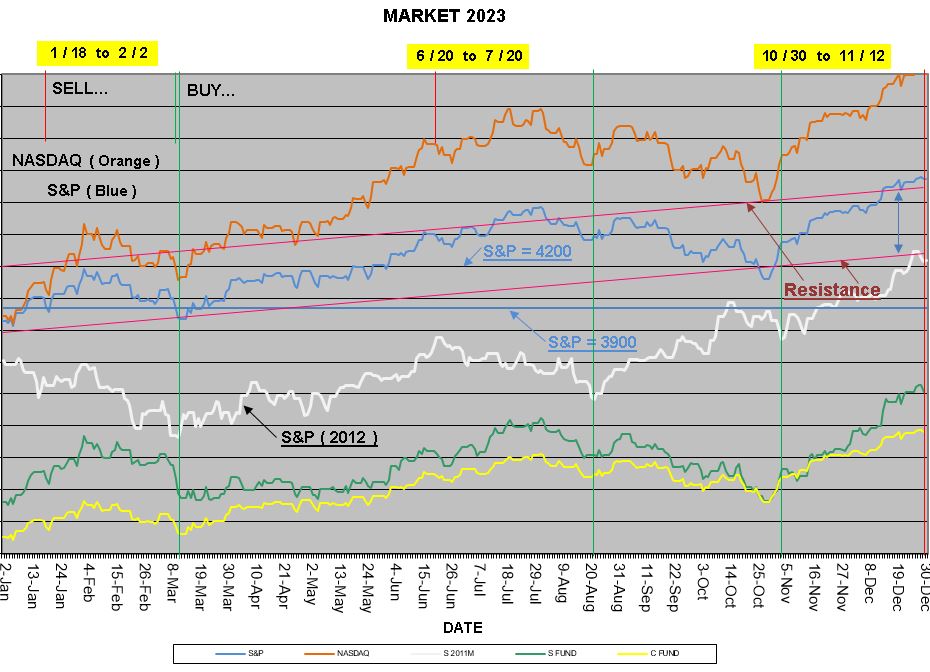
Following 2012 Market S&P results (based on amount of liquidity added to the Market in 2009 & now 2020…
NOTE: Liquidity is being removed, so after August is questionable…
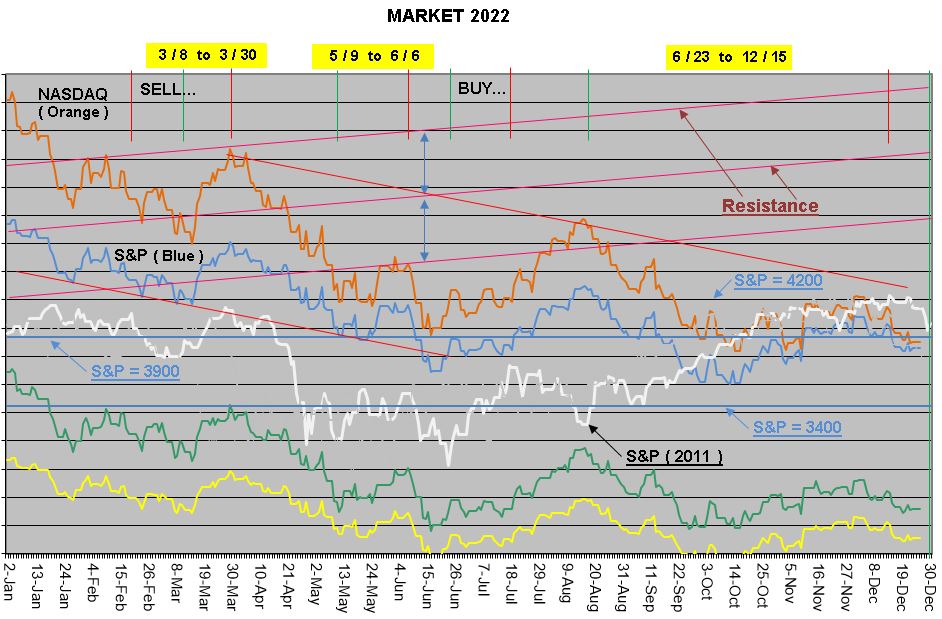
Following 2011 Market S&P results (based on amount of liquidity added to the Market in 2009 & now 2020…
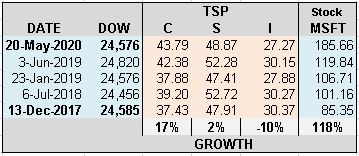
The Table (below) shows how the Equity (stock) Market exponentially out-performs when compared to TSP or 401K plans ( before & after MARKET meltdown ).
CLICK here for calendar info…
? Economic Cyclical Chart
shows where to allocate all or part of your money by date
( up 31.4% in year 2021…).
( up 2.4% in year 2022…).
Say you had $300K in the TSP “S” fund (or 401K) in Sept 2018. By Christmas 2018, you had only $226K ( –24.7% ).
To get even, you needed a % gain greater than the % lost ( +32.9% ).
By FEB 2020, you had $325K ( +43.9% ). You may think you made $100K in 2019, but that’s because you didn’t track your lost from 2018…
By MAR 6 2020, you have only $277K ( –14.8% ). And are now down in the last 18 months…
The Good News… With 5% contributions of $100K salary & 4% Agency match from Sept 2018, you have your additional contribution ($7.6K) plus 96% of Agency match (a gain of $6K in 18 months). So, adjusted balance $283K ( –13.0% ).
MEANWHILE: despite no matching agency funds, if you had $300K in Microsoft stock in Sept 2018. You would now have $447K today (down from $522K in FEB). A gain of ( +32.9% ).
That’s why 401K aren’t that great in an economy with unregulated capitalism. By retirement, greed & inflation will kick your butt…
UPDATE: By Sept 7 2020, you have only $320K ( +7% ) in your TSP now (not much to show for the last 24 months)…
You would now have $585K ( +95% ) today ( in Microsoft stock )…
? Recommended Stocks
shows my picks.
OTHER CHARTS:
? Recessions by Political Parties
? Market Performance by President
If you want to open a Stock Market Trading Account:
Under $5,000, then join.Robinhood.com/George815
Over $5,000 & plan to add more, then TDameritrade.com and I can send you a referral.