
NFL Predictions
Picking NFL Winners ?
( for SUPERBOWL… )
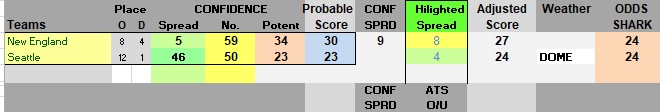
Last Superbowl meeting (XLIX) Patriots 28 – Seattle 24
The last column is the predicted score.
NOTE: The score are based mostly on last year’s data until Week 6…
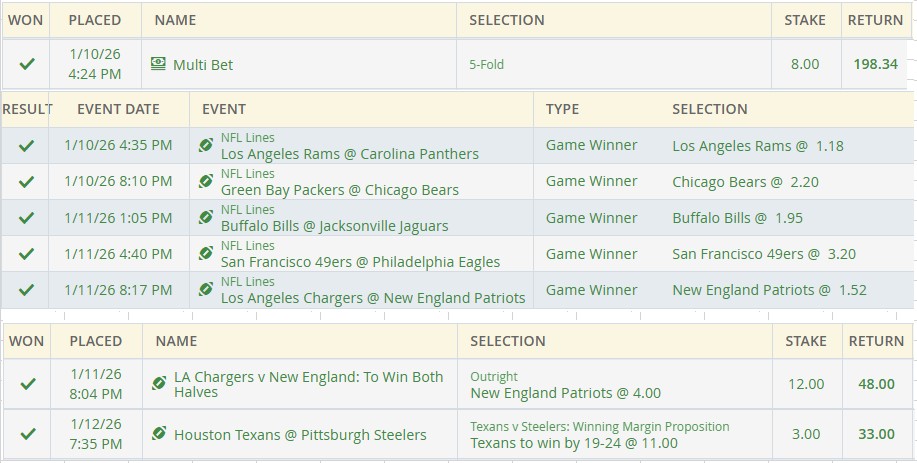
My Winners Last Week…
( for WILD CARD… )
ATS: (YELLOW / BLUE “Highlighted Spread 7+” )
WEEK 7 = 4 – 4 – 0 50%
WEEK 8 = 11 – 1 – 0 92%
WEEK 9 = 3 – 3 – 0 50%
WEEK 10 = 6 – 3 – 0 67%
WEEK 11 = 3 – 6 – 0 33%
WEEK 12 = 7 – 5 – 1 54%
WEEK 13 = 5 – 10 – 0 33%
WEEK 14 = 7 – 2 – 1 70%
WEEK 15 = 6 – 3 – 0 67%
WEEK 16 = 7 – 5 – 0 58%
WEEK 17 = 5 – 7 – 0 42%
WEEK 18 = 10 – 3 – 1 77%
WILD CARD = 4 – 2 – 0 67%
2025
TOTAL ATS… = 78 – 54 – 3 59%
2024
TOTAL ATS… = 68 – 45 – 4 60%
2023
TOTAL ATS… = 53 – 45 – 1 54%
2022
TOTAL ATS… = 34 – 22 – 0 61%
2021
TOTAL ATS… = 35 – 21 – 2 63%
The confidence ( CONF ) column reflects the current Power Rankings for NFL teams. The Confidence Spread ( CONF SPRD ) column reflects the difference between the two teams playing. The higher the CONF SPRD number – the better chance that the winning team will make their predicted score ( Adjusted Score ).
NOTE: The “Highlighted Spread” column shows the “Against The Spread” (ATS) advantage (TOP number) and the Total Points “OVER / UNDER” (O/U) advantage (BOTTOM number) for the Predicted Score.
The higher the number – the better chance of winning.
TOP number: If the number is positive, the AWAY team has the advantage. If the number is negative, the HOME team has the advantage.
BOTTOM number: If the number is positive, the Total OVER has the advantage. If the number is negative, the Total UNDER has the advantage.